Welcome to this comprehensive guide on how to use Google Sheets for data entry and visualization. As a student, it’s essential to have a tool that not only allows you to easily input and organize data but also provides powerful visualization capabilities. In this guide, we will take you through the process on how to use Google Sheet to its fullest potential, from setting up your spreadsheets to creating stunning visual representations of your data.
Getting Started with Google Sheets:
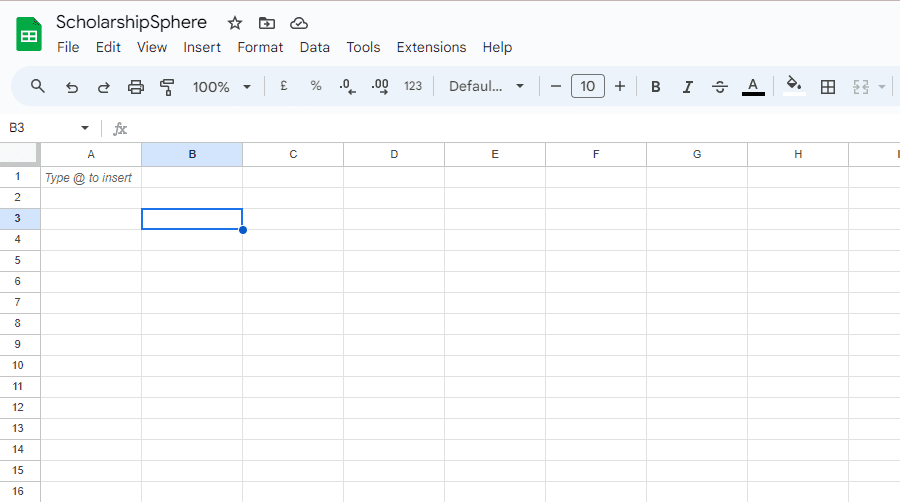
To begin our journey with Google Sheets, let’s first understand how to create a new sheet and access its various features. Follow these simple steps to get started:
- Open your web browser and visit the Google Sheets website (google.com/sheets) or access it through Google Drive.
- Sign in to your Google account or create a new one if you don’t have one yet. Once you’re signed in, click on the “+ New” button to create a new spreadsheet.
- Give your spreadsheet a meaningful name that reflects the purpose or subject of your data.
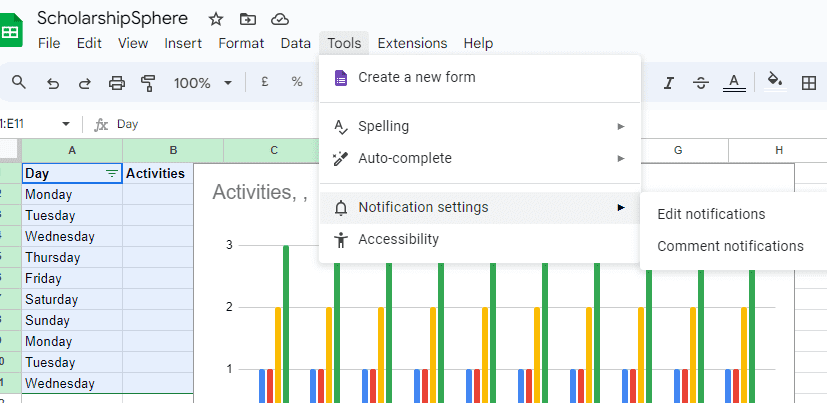
- Familiarize yourself with the Google Sheets interface, including the toolbar, menu options, and various buttons.
Understanding Data Entry in Google Sheets:
Efficient data entry is the foundation of any successful data analysis. In this section, we will guide you through the different methods of entering data into Google Sheets and learn some useful tips:
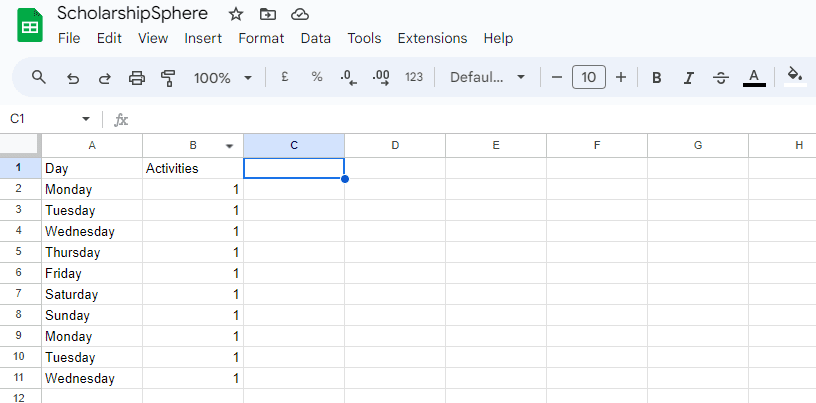
1. Manual Data Entry:
Manually entering data into Google Sheets is a straightforward process. Simply click on the desired cell and start typing. To move to the next cell, press the Tab key or the right arrow key.
2. Importing Data from External Sources:
Google Sheets also allows you to import data from external sources, such as CSV files, Excel spreadsheets, and Google Forms. This can save you significant time and effort, especially when dealing with large datasets.
Organizing and Formatting Data:
Properly organizing and formatting your data enhances its readability and facilitates data analysis. Let’s see some important steps for organizing and formatting data in Google Sheets:
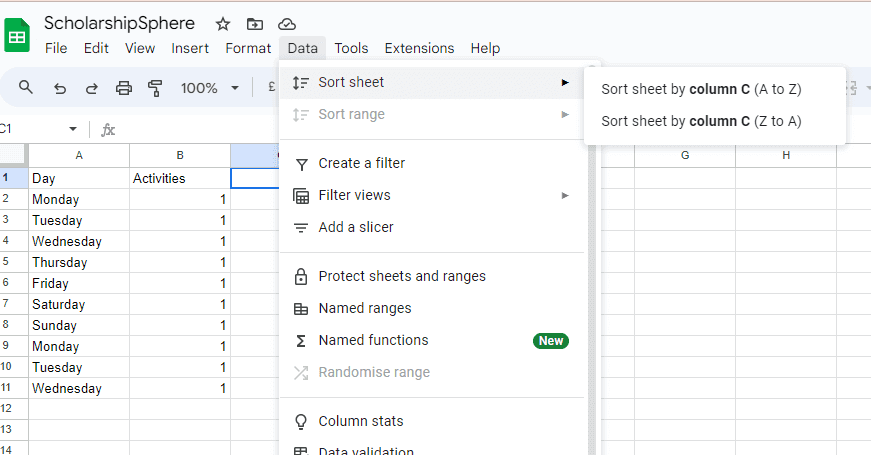
Sorting and Filtering Data
Sorting and filtering enable you to quickly arrange your data in a desired order or display specific subsets of data based on certain criteria. Mastering these functions will make your data more accessible and manageable.
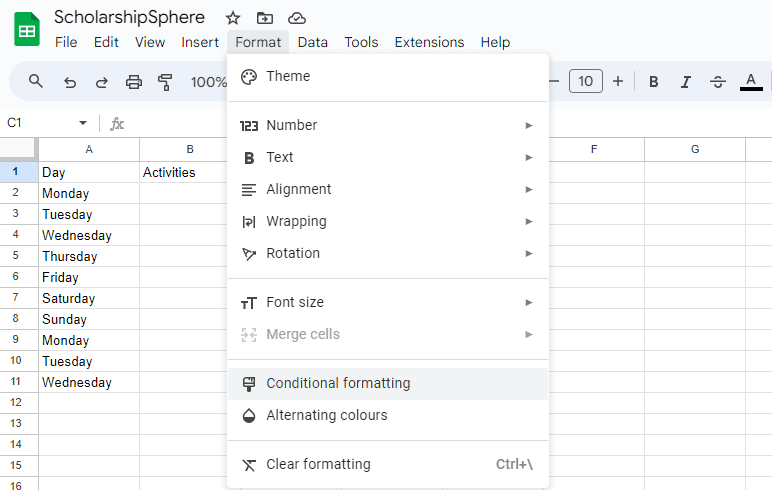
Applying Conditional Formatting:
Conditional formatting allows you to highlight specific cells or ranges based on custom criteria. This feature aids in data visualization by emphasizing important patterns or outliers within your dataset.
Creating and Customizing Tables:
Tables in Google Sheets offer a powerful way to organize and analyze your data. Learn how to create tables, apply table styles, and use table formulas to perform calculations within specific ranges.
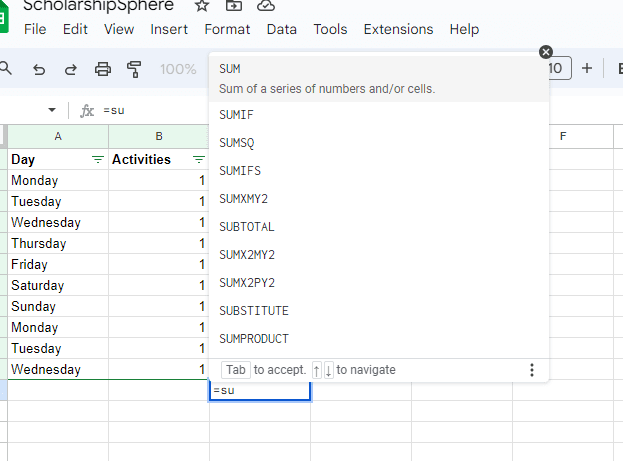
Using Formulas and Functions for Data Analysis:
Google Sheets provides a wide range of formulas and functions that enable you to analyze and manipulate your data effectively. Let’s see some essential formulas and functions:
Basic Mathematical Formulas:
Perform simple calculations, such as addition, subtraction, multiplication, and division, using basic mathematical formulas. These formulas are the building blocks of more complex data analysis.
Statistical Functions:
Use statistical functions in Google Sheets, such as averages, medians, standard deviations, and more. These functions help you derive valuable insights from your data and make data-driven decisions.
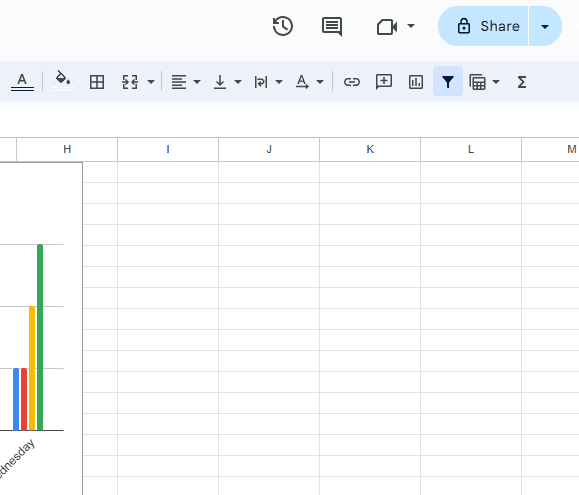
Visualizing Data with Charts and Graphs:
Visual representations of data are often more impactful and easier to comprehend than raw numbers. See how you can visualize your data in charts and graphs.
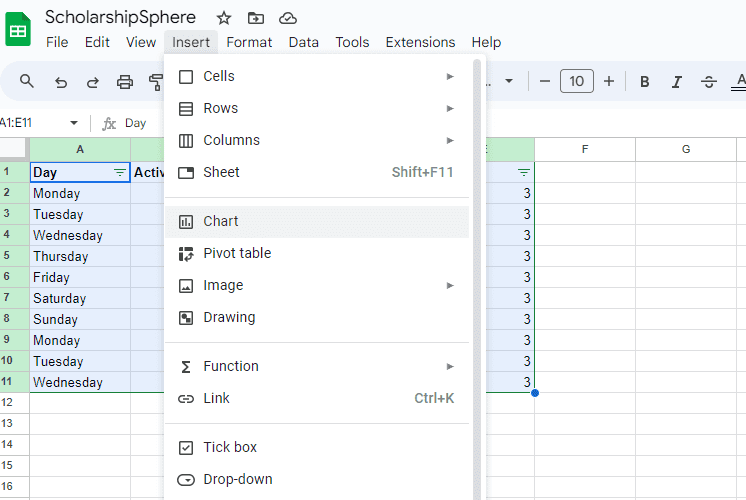
Types of Charts and Graphs:
Explore various chart types, such as bar charts, line graphs, pie charts, and scatter plots. Discover the situations in which each type of chart is most effective for visualizing specific types of data.
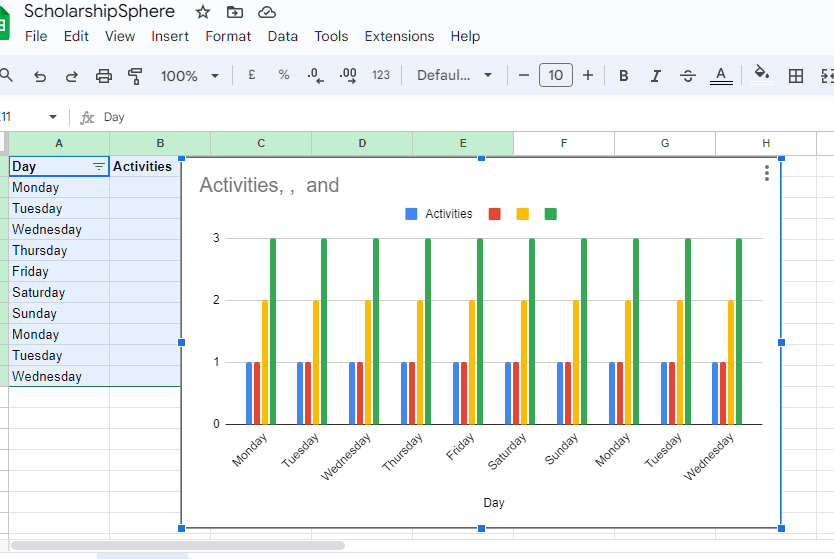
Customizing Charts and Graphs
Customize the appearance of your charts and graphs by adjusting colors, labels, titles, and other visual elements. Make your visualizations more visually appealing and aligned with your intended message.
Collaborating and sharing sheets:
Google Sheets excels at collaboration, allowing multiple users to work on the same sheet simultaneously. See how you can share your sheets effectively:
Sharing and Permissions:
Understand the different sharing options available in Google Sheets and how to set permissions to control who can view, comment on, or edit your sheets. Keep your data secure while enabling seamless collaboration with others.
Tracking Changes and Version History:
Google Sheets keeps track of changes made by different collaborators and provides version history. You can see who made changes, restore previous versions, and collaborate effectively with others.
Conclusion:
Congratulations on reaching the end of our comprehensive guide on how to use Google Sheet for data entry and visualization. We have covered everything from the basics of creating a sheet to advanced techniques for organizing, analyzing, and visualizing your data. By following these steps, you can make the most of Google Sheets to streamline your academic projects, research, and data-driven decision-making. Remember, practice makes perfect, so keep experimenting and exploring new possibilities with Google Sheets.
See: How to Use Canva for Education
Enjoy this blog? please spread the word.